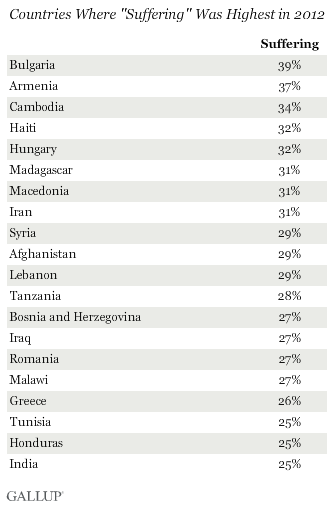
WASHINGTON, D.C. -- For the third year in a row, Bulgaria in 2012 once again had the negative distinction of leading the global suffering list, with 39% of Bulgarians rating their lives poorly enough to be considered "suffering." However, this time, Bulgaria is not alone at the top. Thirty-seven percent of Armenians were suffering, and Cambodians, Haitians, Hungarians, Malagasy, Macedonians, and Iranians followed closely behind.

Gallup classifies respondents as "thriving," "struggling," or "suffering" according to how they rate their current and future lives on a ladder scale with steps numbered from zero to 10 based on the Cantril Self-Anchoring Striving Scale. Gallup considers people to be suffering if they rate their current lives a 4 or lower and their lives in five years a 4 or lower. The respondents do not label themselves as suffering.
In 20 out of 143 countries and areas surveyed in 2012, at least a quarter of the adult population rated their lives poorly enough to be considered suffering. Those countries span most world regions, including six places in crisis-hit Europe. Worldwide, one in seven adults was suffering in 2012. South Asia led the world in suffering at 24%, followed by 21% in the Balkans and the Middle East and North Africa regions.
Low Levels of Suffering Mostly Seen in Wealthier Countries
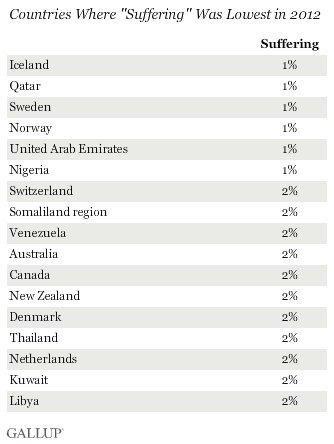
Suffering was 2% or less in 17 countries and areas -- most of them wealthier and more developed countries. Some developing countries also made this list: Thailand, Venezuela, Nigeria, the Somaliland region, and Libya. Gallup trend data show suffering in the first four countries and areas has been consistently low since Gallup started surveying in these places. The 2012 study in Libya is the only nationally representative study Gallup conducted so far in this country.
Suffering in Venezuela has always been in the single digits, yet in 2012, suffering was exceptionally low. With fieldwork being conducted in the run-up to the presidential elections in October 2012, the government's spending spree ahead of the elections might at least partially explain the drop in suffering from 7% in 2011 to 2%.
In Libya, many people were probably still enthused by having rid the country of Moammar Gadhafi, who ruled in a dictatorship lasting more than four decades.
Four percent of Americans were suffering in 2012.

Implications
Across countries, measures of well-being are highly related to income, education levels, and reported disease conditions. Individuals who are thriving have fewer disease conditions, fewer sick days, and higher incomes; are more highly educated; and have better work environments. Residents in countries with higher percentages of thriving respondents also report that the area they live in is a good place to live for people of different ethnicities, races, and cultures.
Compared with thriving respondents, struggling respondents are much more likely to worry about money on a daily basis, and suffering respondents are less likely to have necessities such as food and shelter.
Leaders in Bulgaria started to face the likely consequences of high levels of suffering among the country's residents in 2013. Protests that spread throughout the country resulted in the resignation of the center-right government of Boyko Borisov. However, in the poorest state in the European Union, conflict over poverty and corruption continues despite the early elections that happened in May of this year.
For complete data sets or custom research from the more than 150 countries Gallup continually surveys, please contact us.
Survey Methods
Results are based on telephone and face-to-face interviews with approximately 1,000 adults, aged 15 and older, per country. For results based on the total sample of national adults, one can say with 95% confidence that the maximum margin of sampling error ranged from a low of ±1.7 percentage points to ±5.6 percentage points. The margin of error reflects the influence of data weighting. In addition to sampling error, question wording and practical difficulties in conducting surveys can introduce error or bias into the findings of public opinion polls.
For more complete methodology and specific survey dates, please review Gallup's Country Data Set details.

