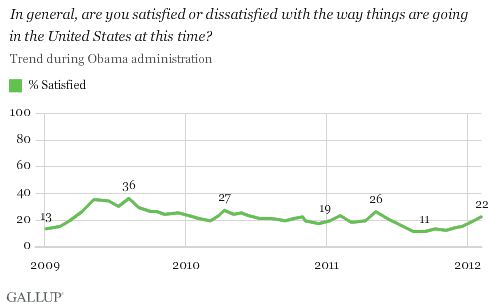
PRINCETON, NJ -- The majority of Americans remain dissatisfied with the way things are going in the U.S., but the percentage who are satisfied continues to increase. Satisfaction, now at 22%, is higher than at any point since last spring.

Thirteen percent of Americans were satisfied with the state of the nation when President Barack Obama took office in January 2009. This percentage increased to as high as 36% in August 2009 before falling to the lower levels seen since then. As the economy struggled to recover during the past two years, and as the federal government had trouble reaching agreement on the major issues facing the country, satisfaction dropped, to as low as 11% last August and September.
The current results, based on a Feb. 2-5 Gallup poll, find satisfaction up significantly from December after slight increases each of the past two months. The increases are likely due to Americans' greater optimism about the U.S. economy. The poll included three days of interviewing after the government released its positive employment report on Feb. 3.
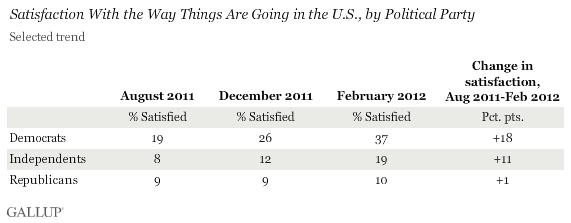
The recent increases in satisfaction are seen mostly among Democrats and independents, with Republicans generally holding near 10%.

Economy, Jobs Continue to Rank as Most Important Problems
Although Americans are more optimistic about the economy than they have been in recent months, economic concerns remain uppermost in their minds when they are asked to name the most important problem facing the country. Overall, 71% of Americans mention some economic issue as the most important problem, an increase from 66% in January.
The economy in general (31%) and unemployment (30%) are the two specific problems mentioned most often, as they have been each month since December 2009. Sixteen percent of Americans, the highest percentage since January 1996, mention dissatisfaction with government, which mirrors the finding that Congress now has the lowest approval rating in Gallup history.

Implications
Indicators such as national satisfaction and the most important problem provide insight regarding a president's re-election chances. The current data suggest a mixture of positive and negative clues toward Obama's likelihood of being re-elected this fall.
The increase in satisfaction is a positive sign for President Obama's re-election chances, but the 22% satisfied is still low compared with where it was for other recent presidents who were re-elected.
Also, the fact that the economy remains the dominant concern as the most important problem is another potential hurdle for Obama. In recent elections, Americans have typically been more likely to re-elect incumbents when the percentage mentioning economic issues as the most important problem was relatively low, and less likely to re-elect incumbents in years when economic mentions were relatively high.
With a mixed picture of current U.S. conditions, Obama's re-election chances may hinge on whether coming economic news builds on this month's positive employment report or suggests that the brighter employment and economic picture seen recently was only temporary.
Survey Methods
Results for this Gallup poll are based on telephone interviews conducted Feb. 2-5, 2012, with a random sample of 1,029 adults, aged 18 and older, living in all 50 U.S. states and the District of Columbia.
For results based on the total sample of national adults, one can say with 95% confidence that the maximum margin of sampling error is ±4 percentage points.
Interviews are conducted with respondents on landline telephones and cellular phones, with interviews conducted in Spanish for respondents who are primarily Spanish-speaking. Each sample includes a minimum quota of 400 cell phone respondents and 600 landline respondents per 1,000 national adults, with additional minimum quotas among landline respondents by region. Landline telephone numbers are chosen at random among listed telephone numbers. Cell phone numbers are selected using random-digit-dial methods. Landline respondents are chosen at random within each household on the basis of which member had the most recent birthday.
Samples are weighted by gender, age, race, Hispanic ethnicity, education, region, adults in the household, and phone status (cell phone only/landline only/both, cell phone mostly, and having an unlisted landline number). Demographic weighting targets are based on the March 2011 Current Population Survey figures for the aged 18 and older non-institutionalized population living in U.S. telephone households. All reported margins of sampling error include the computed design effects for weighting and sample design.
In addition to sampling error, question wording and practical difficulties in conducting surveys can introduce error or bias into the findings of public opinion polls.
View methodology, full question results, and trend data.
For more details on Gallup's polling methodology, visit https://www.gallup.com/.
