WASHINGTON, D.C. -- Although people's desire to migrate permanently to other countries has cooled globally to 13%, Gallup's Potential Net Migration Index (PNMI) shows populations would still grow in the Americas, Europe, and the Middle East and North Africa if everyone who wanted to move actually moved to where they wanted. At the same time, populations in sub-Saharan Africa and Asia would still shrink.
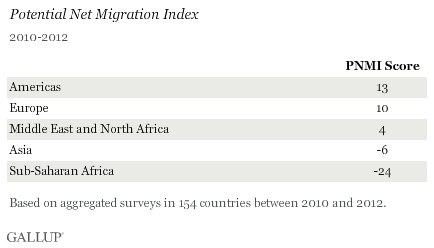
Gallup's PNMI is the estimated number of adults who say they would like to move permanently out of a country if the opportunity arose, subtracted from the estimated number who say they would like to move into it, as a proportion of the total adult population. The higher the resulting positive PNMI score, the larger the potential net adult population gains. The latest results include 154 countries or areas surveyed between 2010 and 2012 and are based on about 520,000 interviews. PNMI scores for 2007 to 2009 are based on surveys in 148 countries and areas and interviews with nearly 348,000 adults. There is no overlap in the results.
Southern Europe's Economic Woes Make It Less Attractive
While Europe's current PNMI score is in the plus category, the story is not the same across the continent. Western Europe's PNMI score is positive at +38% and relatively the same as the +42% measured between 2007 and 2009. But PNMI scores have declined in Southern Europe -- particularly in countries hard hit in the eurozone crisis. Southern Europe's overall PNMI score is half what it was between 2007 and 2009, with large declines in Spain, Italy, Portugal, and Greece. Greece slipped into negative territory from +11% to -8%.
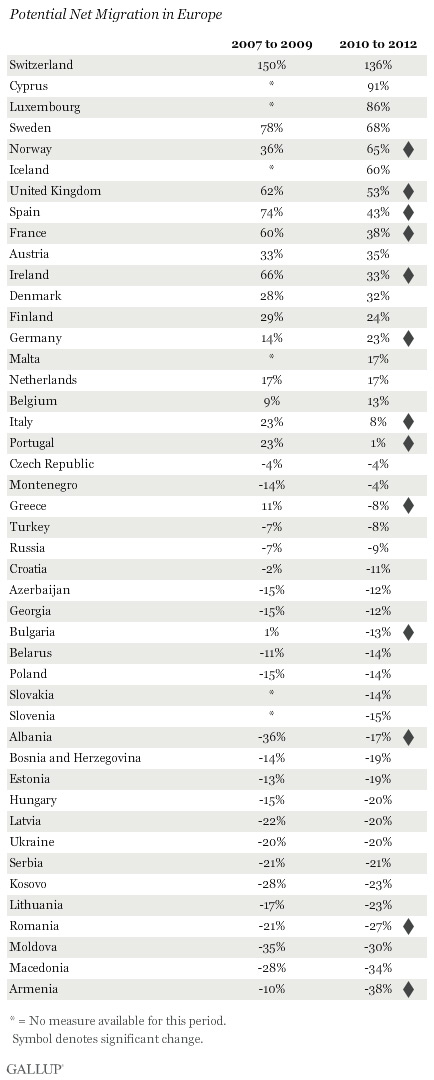
Elsewhere in Europe, PNMI scores did not change and continue be as negative as they were in previous years. Populations would still potentially shrink in Eastern and Southeast Europe, European countries in the Commonwealth of Independent States, and the Caucasus.
PNMI Scores Decline in the U.S and Canada, While Latin America Is Less Negative
Positive scores in two of the top desired destinations in the world, the U.S. and Canada, largely drive the +13% PNMI scores in the Americas. But even in those two countries, PNMI scores have declined, dropping to +120% from +160% in Canada and +45% in the U.S. from +60%.
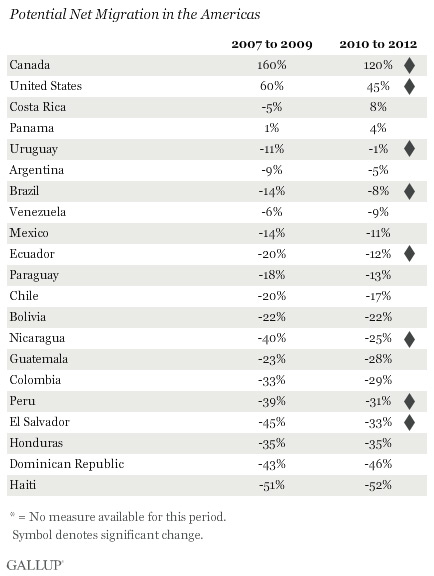
At the same time, scores are less negative in many countries in Latin America, meaning these countries could potentially have less population loss from net migration. Although PNMI scores remain negative in several migrant-sending countries in Central America, scores are less negative in places such as El Salvador and Nicaragua. Scores remain negative -- and flat -- in Mexico.
Potential Net Migration Increasingly Negative in Syria
With several exceptions, PNMI scores in many countries surveyed in the Middle East and North Africa (MENA) region are unchanged from previous years. Notably, Syria's PNMI score has increased to -27% from -17%, no doubt because of the increase in the percentage desiring to leave the war-torn country if they could and fewer adults desiring to relocate there amid a civil war.
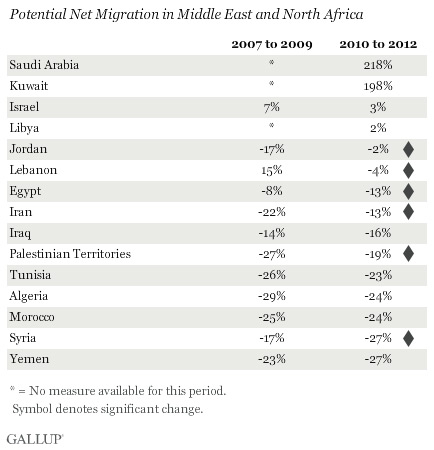
Scores have also changed in two countries that have received many refugees from Syria -- Lebanon and Jordan. Jordan's -2% is not as negative as the -17% in previous years, while Lebanon's current score, -4%, is more negative than its previous score of +15%. Scores have also improved in the nearby Palestinian Territories.
Singapore, Australia, and New Zealand Still Positive; Developed Asia Less Attractive
Asia, which had a positive PNMI score in previous years, could see a net decline as a result of migration if people moved where they wanted. This decrease is largely driven by a decline in desire among potential migrants to relocate to countries in developed Asia and in Australia and New Zealand. Scores in Singapore, Australia, and New Zealand are still positive and high, but they have declined from previous years.
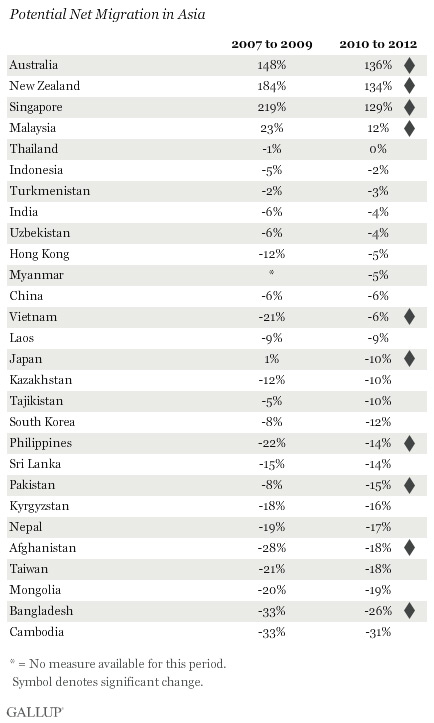
PNMI scores across developing Asia continue to be as negative as they have been in previous years. Scores were negative and flat in two of the world's most populous countries, China and India, with scores of -6% and -4%, respectively.
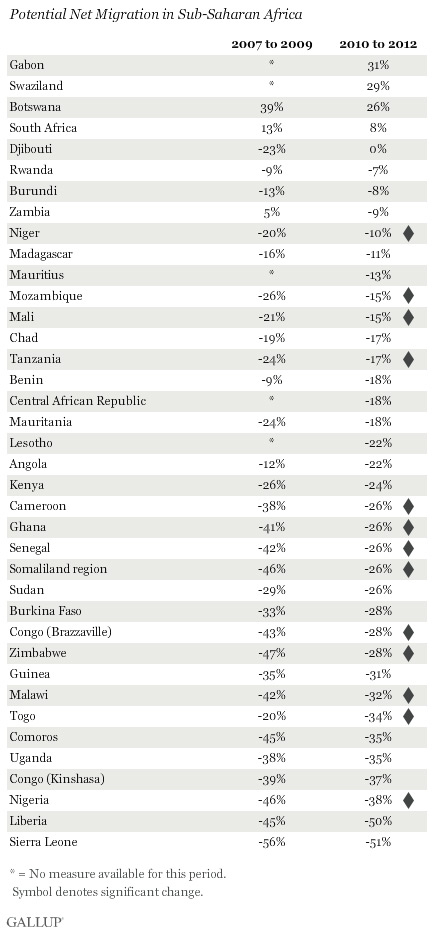
Scores Less Negative in Sub-Saharan Africa
Although sub-Saharan Africa has the highest negative PNMI of all global regions, scores in many countries have improved -- largely because of declining desire to migrate. The biggest improvement is evident in East Africa, particularly in Tanzania and the Somaliland region, where scores are not nearly as negative as they were in previous years.
Bottom Line
While Gallup's findings reflect people's wishes rather than their intentions, they still provide useful information about how populations could potentially change not only in sheer numbers, but also in their human capital. Declining potential net migration scores in many countries -- even those that are highly desired destination countries -- largely reflect cooling worldwide desire to migrate in the aftermath of global economic downturn. As economic conditions improve, the idea of migrating and some of these destinations may become more attractive again.
For complete data sets or custom research from the more than 150 countries Gallup continually surveys, please contact us.
Survey Methods
Results are based on telephone and face-to-face interviews with 519, 108 adults, aged 15 and older, in 154 countries from 2010 to 2012. The 154 countries surveyed are home to more than 98% of the world's population. In Gulf Cooperation Council countries, only Arab nationals and Arab expatriates were surveyed. PNMI scores for countries where non-Arab expats make up more than 50% of the adult population are not reported: United Arab Emirates, Bahrain, and Qatar. Index scores are not reported for countries where total sample sizes are 500 or lower because of the volatility in the index as measured by the margin of error: Jamaica, Northern Cyprus, Suriname, and Trinidad and Tobago.
For most countries, aggregated sample sizes (across multiple years of surveys) range between 3,000 and 6,000 interviews. A total of 19,598 interviews were conducted in India, 8,018 in China, and 9,000 in Russia.
The PNMI is measured on a scale of -100 (meaning the total adult population of the country would leave) to infinity (meaning the potential inflow of adult population to the country is unlimited and depends on the number of adults who want to move in from around the world). As with any survey-based estimate, the PNMI has a corresponding margin of error for each country, calculated using the standard error of the index. Sample size, size of the country, and range in population projection weights affect the PNMI margin of error.
For example, the PNMI for El Salvador is estimated at -33%, meaning if all adults who desire to move in and out of the country did so, the adult population would decline by 33%. With the margin of error at the 95% confidence level, this estimate ranges from -36% to -30%.
Gallup's PNMI is based on responses to the following questions:
Ideally, if you had the opportunity, would you like to move permanently to another country, or would you prefer to continue living in this country?
(If "would like to move permanently to another country") To which country would you like to move? [open-ended, one response allowed]
For more complete methodology and specific survey dates, please review Gallup's Country Data Set details.