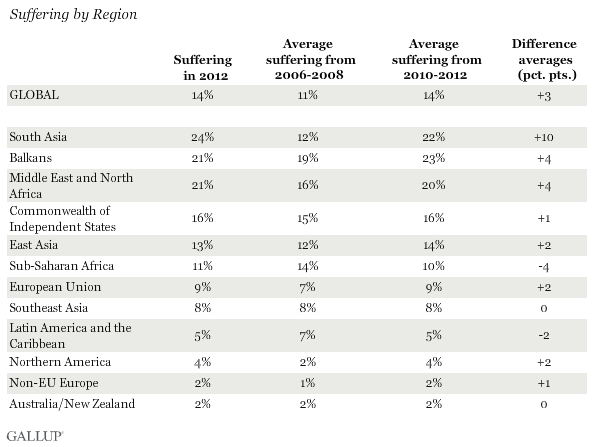
WASHINGTON, D.C. -- Suffering, on average, has increased worldwide in the past several years, and nowhere more than in South Asia. One in seven adults worldwide rated their lives poorly enough to be considered suffering in 2012. South Asia led the world in suffering at 24%, followed by 21% in the Balkans and the Middle East and North Africa.

Gallup classifies respondents as "thriving," "struggling," or "suffering" according to how they rate their current and future lives on a ladder scale with steps numbered from 0 to 10, based on the Cantril Self-Anchoring Striving Scale. Gallup considers people to be suffering if they rate their current lives a 4 or lower and their lives in five years a 4 or lower. The respondents do not label themselves as suffering.
Comparing average suffering for 2006-2008 with the average for 2010-2012, suffering increased by three percentage points worldwide. South Asia clearly registers the biggest increase in suffering during this period and because of its large population, it is mostly responsible for the worldwide uptick. Suffering in the region has increased enormously since the beginning of the global financial and economic crisis, averaging 12% between 2006 and 2008, and 22% between 2010 and 2012.
Latin America and the Caribbean and sub-Saharan Africa defy the global trend. Between 2010 and 2012, residents of both regions were on average less likely to be suffering than they were before the outbreak of the global economic crisis. Resource-oriented, emerging-market economies in both regions largely managed to avoid the recession that plagued more mature economies in Northern America and Europe.
India Mainly Drives Deterioration of Well-Being in South Asia
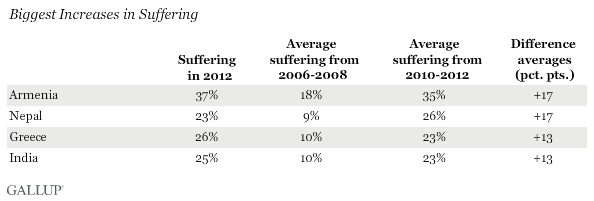
The massive increase in suffering among South Asians is largely attributable to negative developments in India, the region's giant. Average suffering in India more than doubled between 2006 to 2008 and 2010 to 2012. In 2012, a full quarter of Indians were suffering. The significant deterioration in Indians' well-being is likely to be rooted in the country's disappointing economic performance. India's growth rate has now sunk from 9.4% in the first quarter of 2010 to 4.4% in the second quarter of 2013, the worst quarterly rate since 2002.

India's northern neighbor Nepal has fared no better. Average suffering there increased by 17 percentage points between 2006-2008 and 2010-2012. Yet because of its relatively small population, the increase in suffering had a negligible effect on the regional average. Since Nepal abolished the monarchy five years ago, the country has been mired in a political crisis that has paralyzed the economy.
Other big increases in suffering in recent years have been registered in Armenia (+17 points) and Greece (+13 points). Greece's economic collapse, record unemployment, and drastic austerity measures contributed to suffering reaching 26% in 2012. Gallup's trend data clearly show Armenians souring in recent years on issues such as their standard of living, and rising frustration with their leaders.
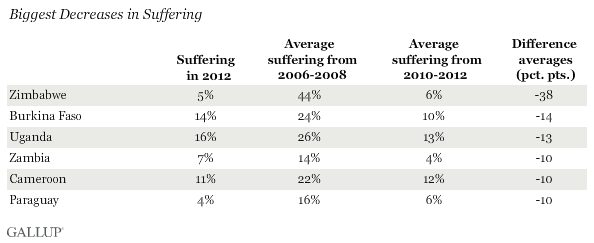
Most countries with the biggest decreases in suffering, comparing the three-year average from 2006 to 2008 with that from 2010 to 2012, are from Sub-Saharan Africa. Suffering in Zimbabwe has decreased by as much as 38 percentage points. After years of hyperinflation, the Zimbabwean government finally abandoned the country's currency in 2009. As a result, the economy started growing again, improving the lives of many Zimbabweans.

Implications
Although global economic growth rebounded in 2010 after the deepest recession in decades, the pace of the world economy has been slower since 2011 than before the crash -- too slow to create enough good jobs for ever more young adults entering the labor market. This in turn likely led to a global increase in suffering.
It is important for leaders in nations where suffering is highest to take a hard look at what they must change in their countries to improve how their people perceive their own lives and their future. The Indian government's failure to cut graft and red tape, as well as to liberalize its markets for labor, energy, and land, explains why the World Bank continues to rank the country as a bad place to do business. Now New Delhi is trying a different strategy to improve the well-being of its people. It just passed the Right to Food Act to provide food at subsidized rates to 71% of its population.
For complete data sets or custom research from the more than 150 countries Gallup continually surveys, please contact us.
Survey Methods
Results are based on telephone and face-to-face interviews with 230,083 adults, aged 15 and older, conducted in 2012 in 143 countries and areas. For the 2012 results based on the total global sample, one can say with 95% confidence that the margin of sampling error is less than ±1 percentage point. For the 2012 results based on the regional samples, the margin of error ranges from a low of less than ±1 percentage point for the European Union to a high of ±2.2 percentage points for the non-EU Europe group. The margin of error for individual countries surveyed in 2012 ranges from ±1.7 percentage points to ±5.6 percentage points. Projection weighting was performed so that each country's data are proportional to the total world population.
For more complete methodology and specific survey dates, please review Gallup's Country Data Set details.
