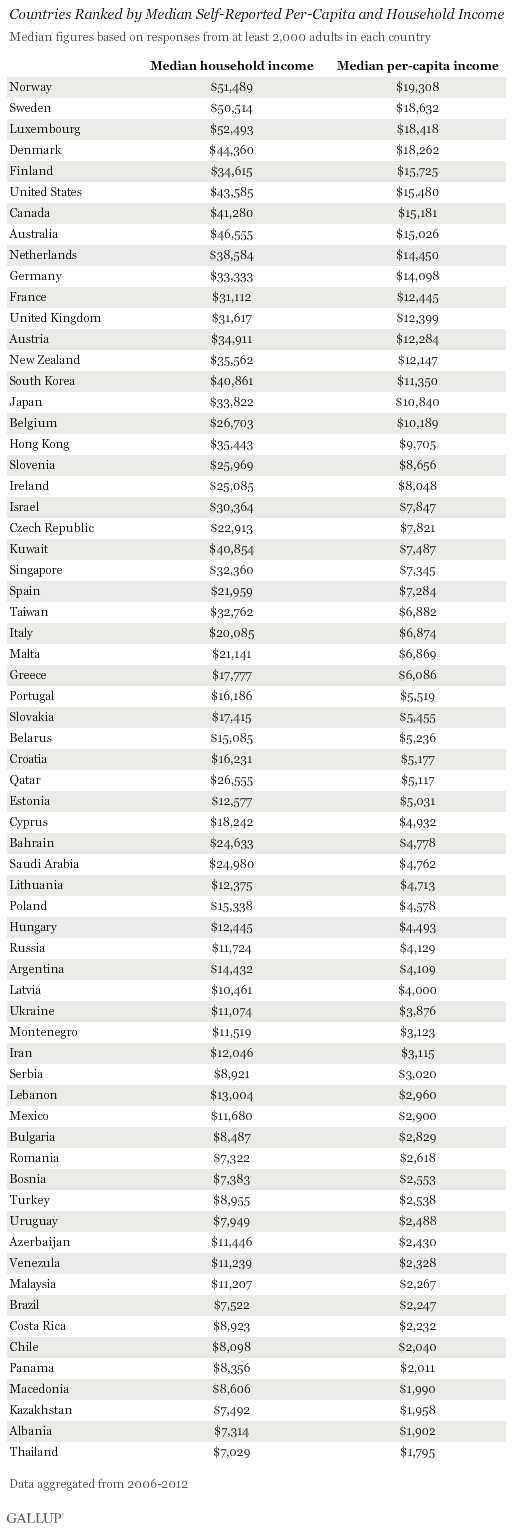
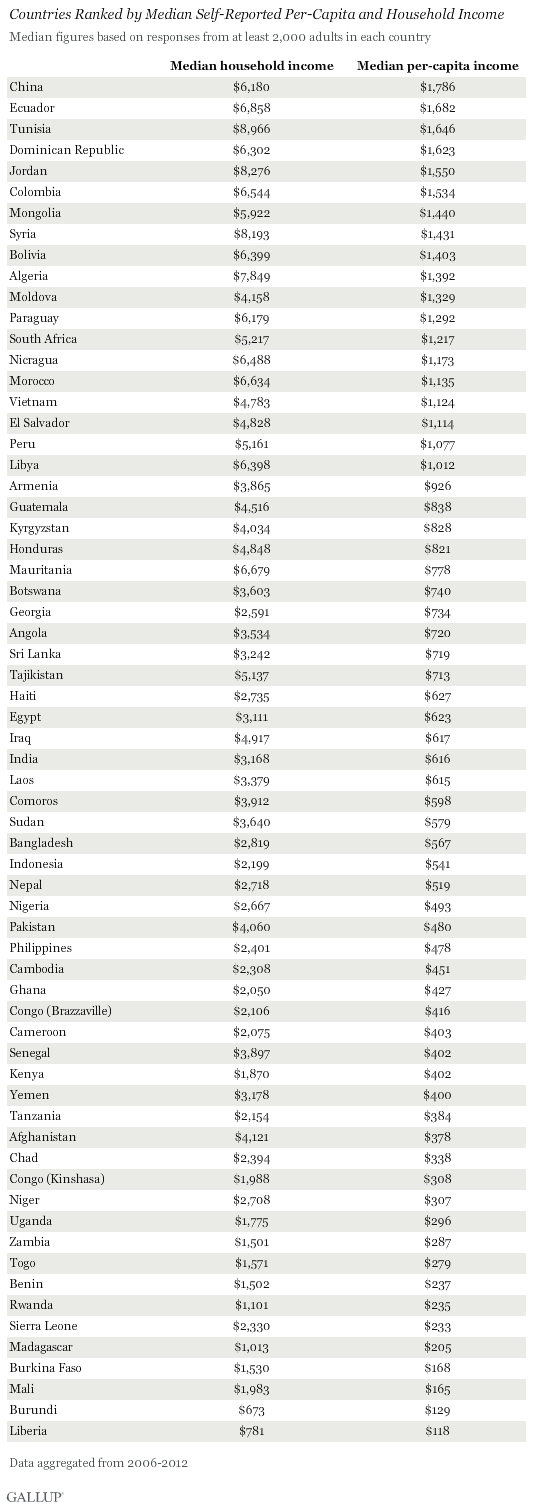
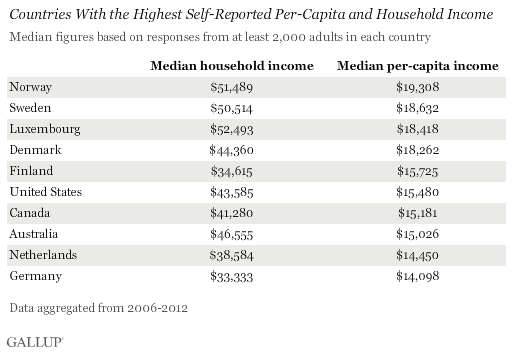
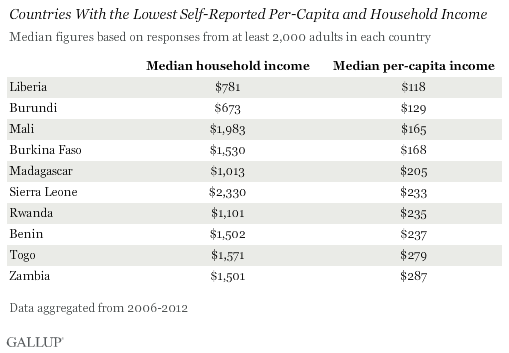
WASHINGTON, D.C. -- The median annual household income worldwide is $9,733, and the median per-capita household income is $2,920, according to new Gallup metrics. Vast differences between more economically developed countries and those with developing or transitional economies illustrate how dramatically spending power varies worldwide. Median per-capita incomes in the top 10 wealthiest populations are more than 50 times those in the 10 poorest populations, all of which are in sub-Saharan Africa.
These results are based on Gallup data gathered between 2006 and 2012 in 131 populations. To calculate an internationally comparable household income measure, Gallup asked respondents in most countries the following question: "What is your total monthly* household income in [local currency], before taxes? Please include income from wages and salaries, remittances from family members living elsewhere, farming, and all other sources. Again, please provide your total monthly household income." (*In Organisation for Economic Co-operation and Development countries where appropriate, the question asked about annual rather than monthly income.)
Those respondents who hesitate to answer or have trouble coming up with a precise estimate are presented a set of income ranges in their local currency and asked which group they fall into. Their estimates are taken as the midpoint of the range. Estimates of household income are expressed in international dollars, created using the World Bank's individual consumption PPP conversion factor, making income estimates comparable across all 131 countries. Yearly and country-level data are available through Gallup Analytics.
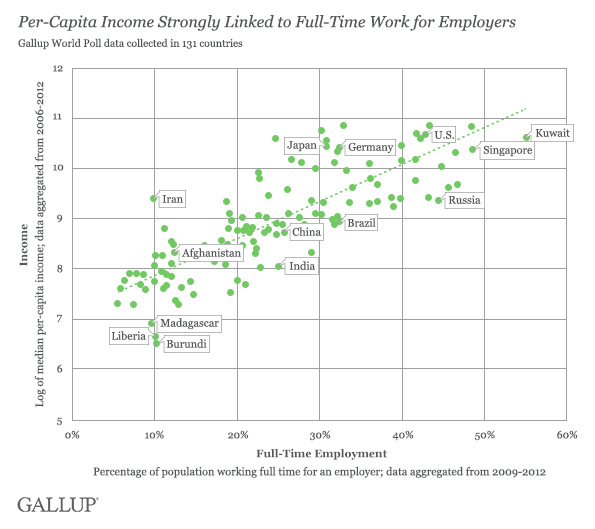
Income Related to Prevalence of Full-Time Work for Employers
Gallup's income measures are strongly associated with the proportion of adult residents in each country who say they are employed full time for an employer -- a measure Gallup refers to as "Payroll to Population." The Payroll to Population metric gauges the prevalence of formal full-time employment in a country, as opposed to part-time or intermittent work or subsistence-level self-employment. Countries with high Payroll to Population figures also have high average incomes.
Bottom Line
In recent years, political leaders, policymakers, and academics have criticized the use of traditional macroeconomic indicators, such as per-capita gross domestic product or gross national income, as insufficient for characterizing the quality of life for a country's population. The assumption that the richer the country, the better off its people are is a useful generalization, but there has been growing recognition among economists and policymakers that traditional economic indicators are not adequate when it comes to characterizing a population's well-being.
Understanding how a country's overall economic performance affects the quality of life of its residents requires "bottom-up" metrics that complement and expand on macro-level information. Income data collected at the household level have tremendous utility for achieving this task, but there has been no comprehensive or uniform source of these data before now. Through its World Poll, Gallup has collected estimates of household income and related measures at least annually in more than 130 countries for the past seven years. The results offer the potential for powerful new insights into how income relates to other developmental indicators such as employment conditions and residents' overall well-being.
Ming-Yi Wu contributed to this report.
For complete data sets or custom research from the more than 150 countries Gallup continually surveys, please contact us.
Survey Methods
Results are based on telephone and face-to-face interviews with approximately 1,000 adults, aged 15 and older, per survey administration. Income data come from interviews were conducted in 131 countries and regions from 2006 to 2012. Data for each country have been aggregated over multiple administrations; at least 2,000 interviews are required for a country to be included in the income data set. For results based on each sample of national adults, one can say with 95% confidence that the maximum margin of sampling error ranged from a low of ±1.4 to a high of ±4.7. The margin of error reflects the influence of data weighting. In addition to sampling error, question wording and practical difficulties in conducting surveys can introduce error or bias into the findings of survey data.
With some exceptions, all samples are probability based and nationally representative of the resident population aged 15 and older. Exceptions include areas where the safety of interviewing staff is threatened, and in some countries, scarcely populated islands or areas that the interviewers can reach only by foot, animal, or small boat.
For more complete methodology and specific survey dates, please review Gallup's Country Data Set details.
